Feature #1517
open
Cumulative flow diagrams of trackers as some sort of project burn down graph
Description
I'd like to see some sort of burn down graph for redmine. It could help all stakeholders to understand the current status of the ongoing projects. I attached two images to illustrate, what kind of diagrams I'm imagining. As there are multiple trackers in redmine, it would be nice to see on one page and with one or two diagrams, how the progress per tracker is.
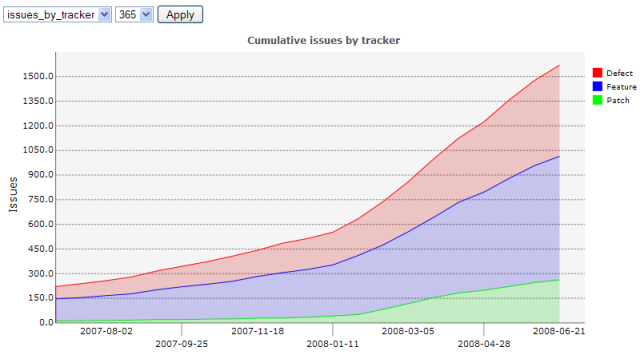
First graph (svg graphs like the statistics view in the repository section would be awesome) could display features. Second graph could contain multiple trackers. So you can see instantly what kind of trackers are increasing/declining (e.g. more and more bugs or feature requests appearing, but nothing gets fixed). The next cool thing about these graphs are visible in the first attached image: You can read the current queue length and duration of a tracker directly from the picture. Awesome for all project stakeholders, I guess.
As I can't help coding at the moment, I'm adding this here as a feature request. I didn't have a look at the source lately, but I think, that most of the data is already there to create such diagrams. Thanks for redmine. It's nice! :)
Iamges courtesy of Mike Griffith - visit http://leadinganswers.typepad.com/leading_answers/files/creating_and_interpreting_cumulative_flow_diagrams.pdf for a more thorough explanation of the diagrams.
Files
 Updated by Jean-Philippe Lang almost 18 years ago
- File issues_by_tracker.png issues_by_tracker.png added
Here is what it could look like:
![]()
 Updated by Eric Davis almost 18 years ago
Jean-Philippe Lang wrote:
Here is what it could look like:
I like it.
 Updated by
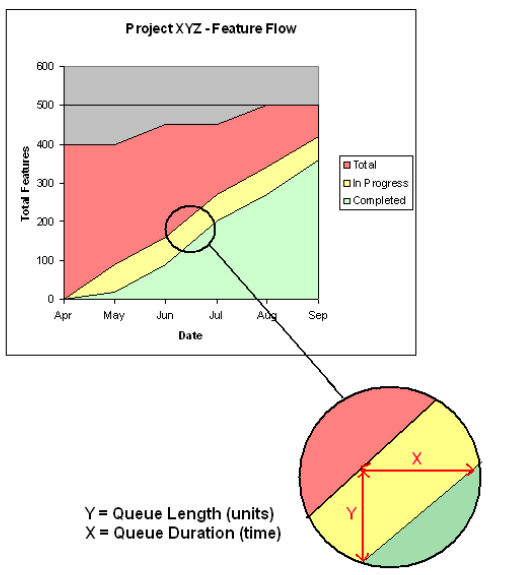
 Updated by Jurgen Kluft almost 18 years ago
+10
Tracking issues visually appeals to a lot of Producers and business people alike. It's an easy way to see the velocity of the project in terms of bug fixing speed, issue resolving speed, or task progression speed.
 Updated by Thomas Capricelli over 17 years ago
I would really be happy to help, but i dont know ruby. You can maybe take inspiration from those projects
http://www.freehackers.org/thomas/tag/activity/
And please contact me if I ever can help in any way. (but learning ruby...)
(i watch this bug, am on irc/freenode as 'orzel', and my email is on my account here)
 Updated by Samuli Tursas over 17 years ago
This would be very useful, and would make Redmine distinctive from other similar apps.
+1 from me.
 Updated by Brad Rushworth over 17 years ago
Jean-Philippe Lang wrote:
Here is what it could look like:
Looks great. We also need a graph that shows issue closure rates though.
 Updated by Jerome Vanthournout over 17 years ago
This graph should be generated based on a selectable issue status (all, open, close, ...) as in the issue list.
I really would like to see this feature implemented in v0.9.
+1
Updated by Eric Davis over 17 years ago
There's a plugin that has some graphing features that you might want to take a look at: http://github.com/edavis10/redmine_charts/tree/master
Updated by Thomas Capricelli over 17 years ago
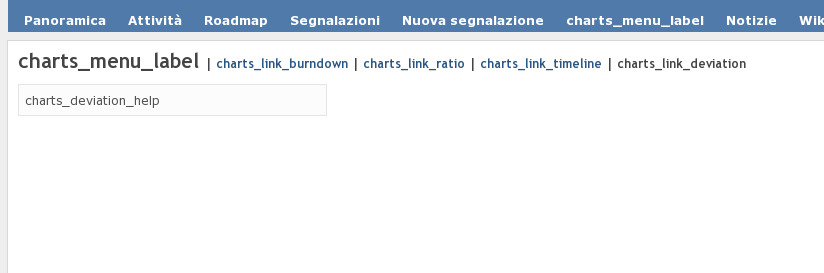
- File chartsbuggy.png chartsbuggy.png added
i've tried it. It's only for timetracking (which i dont use), and it doesn't work with latest trunk for redmine. The menu is called 'charts_menu_label', and submenus have strange names like this too.
But the graphs on the webpage look very good, i'd definitely love to have something like this for bugs, commits, and overall activity.
Updated by Eric Davis over 17 years ago
Thomas Capricelli wrote:
i've tried it. It's only for timetracking (which i dont use), and it doesn't work with latest trunk for redmine. The menu is called 'charts_menu_label', and submenus have strange names like this too.
What language are you using? I'm guessing the plugin author doesn't have a translation for it yet.
Updated by Thomas Capricelli over 17 years ago
i'm using Italian. Shouldn't it display English when no translation is available ??
 Updated by Steffen Gransow about 17 years ago
What's the status on this ticket? :)
The plugin is nice, but shows progress only related to time (estimated, remaining etc.). The intention of this ticket is to create alternative views to the gantt chart for different project stakeholders (that is, burndown graphs with cumulated progress per tracker). This is not the same, as time monitoring per ticket is not necessary for agile development with time boxing and sprints. The team and its managers should have an eye on the timeline, but manage themselves and create values (instead of just constantly updating estimates and time spent etc. on tickets that have to be worked on anyways).
 Updated by Brad Beattie about 17 years ago
I have a plugin that kind of does this. See http://www.redmine.org/attachments/1634/Screenshot-Schedules_Plugin_-_0.2.0_-_Project_Overview_-_Mozilla_Firefox.png
http://github.com/bradbeattie/redmine-graphs-plugin/tree/master
 Updated by Ryan H about 15 years ago
Hate to resurrect an old issue... This would be an awesomely powerful feature to add to redmine. We're evaluating this as a tool at work now (And by evaluating, I mean we're just plain using it for about a month). If it's accepted, it's going to be the developers hinge into our sprints.
One of the major pieces of functionality that we've received criticism in when showing off Redmine is that it does not incorporate enough of Scrum - in this instance, specifically burndown charts (as well as, a backlog, and a few other things.)
Any chance this might get picked up in a near-term (year out) release?
 Updated by yannick quenec'hdu over 14 years ago
+1
Ryan H wrote:
Hate to resurrect an old issue... This would be an awesomely powerful feature to add to redmine. We're evaluating this as a tool at work now (And by evaluating, I mean we're just plain using it for about a month). If it's accepted, it's going to be the developers hinge into our sprints.
One of the major pieces of functionality that we've received criticism in when showing off Redmine is that it does not incorporate enough of Scrum - in this instance, specifically burndown charts (as well as, a backlog, and a few other things.)
Any chance this might get picked up in a near-term (year out) release?
Updated by Steffen Gransow almost 14 years ago
Any news on this? Is there a plugin that provides cumulative flow diagrams that track progress instead of time? Any burndown diagram plugins available that don't track just effort in terms of estimated/elapsed time? If there are I'd be more than happy to close this ticket. ;-)
 Updated by Antonio De Marinis over 11 years ago
Steffen Gransow wrote:
Any news on this? Is there a plugin that provides cumulative flow diagrams that track progress instead of time? Any burndown diagram plugins available that don't track just effort in terms of estimated/elapsed time? If there are I'd be more than happy to close this ticket. ;-)
Steffen Triple X:
here it is, as part of this Agile plugin
you have both burndown and the even better one Cumulative flow diagram
I think you can close this ticket now ;)