 tasks we do monthly (or weekly) - generate "progress chart"
Added by Pavel Yeloyev about 4 years ago
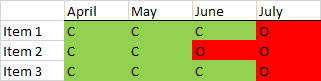
Some issues recur and we have to do them monthly (or weekly, or biweekly, etc...). Is there some way to generate a chart that looks like this (see attached)?
The goal is just to have some wiki page, report, or even app I can click on to know right away what items I need to focus on (*O*pen issues).
| samplechart.png (2 KB) samplechart.png |
Replies (2)
 RE: tasks we do monthly (or weekly) - generate "progress chart"
-
Added by Michael Stanek almost 4 years ago
RE: tasks we do monthly (or weekly) - generate "progress chart"
-
Added by Michael Stanek almost 4 years ago
Hi Pavel, Redmine has a standard export functionality which will only show you a table (as you know). This is a nice little feature you're suggesting. Feel free to use our roadmap to suggest the development of this: https://www.redmine-x.com/redmine-x-plugins/roadmap/roadmap. If you get enough votes, we may pick it for development. We can also do this as an on-demand feature for you.
Michael from https://www.redmine-x.com
RE: tasks we do monthly (or weekly) - generate "progress chart"
-
Added by Pavel Yeloyev almost 4 years ago
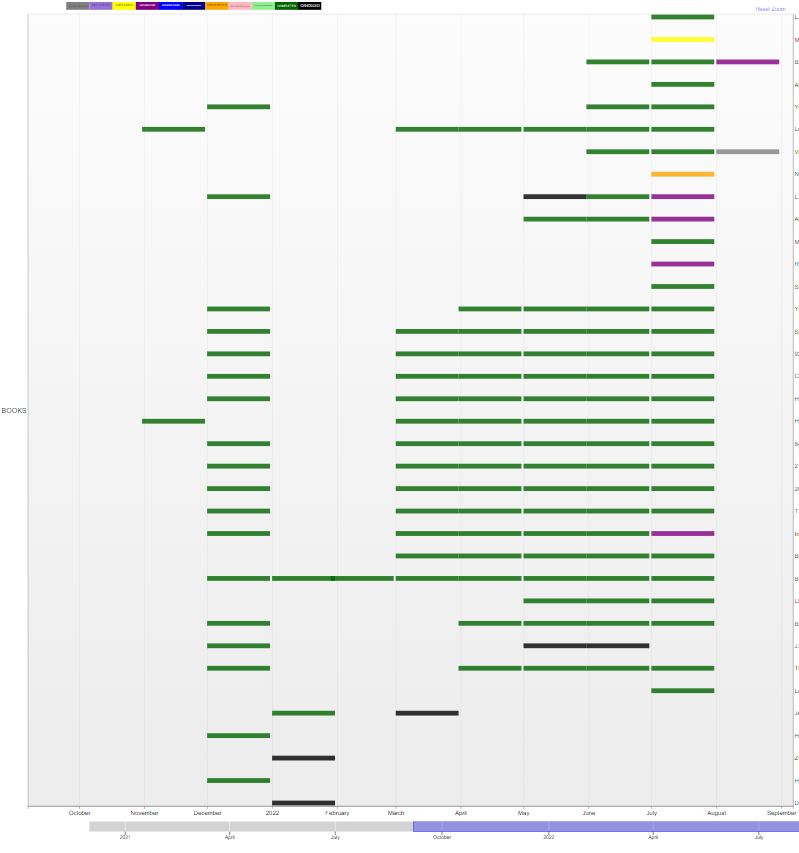
I implemented something custom. Looks like this (see attachments).
Basically it's run by this github project: https://github.com/vasturiano/timelines-chart
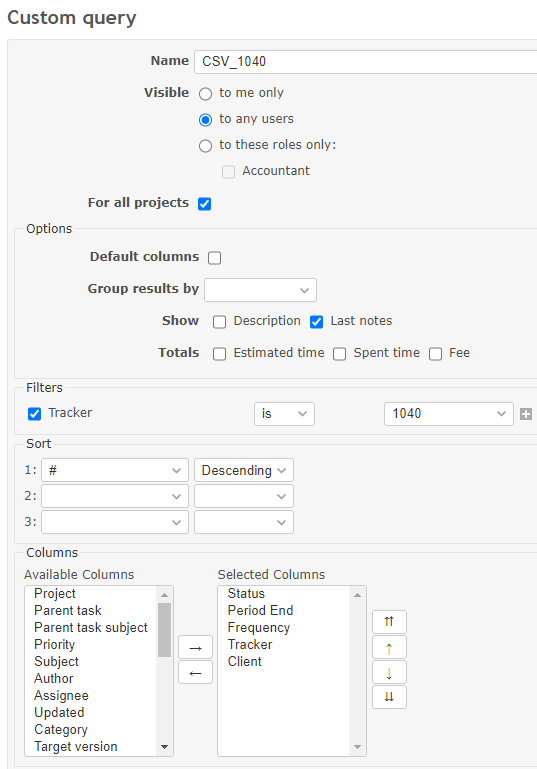
The data is pulled from custom query CSV reports. It's 100% client-side JavaScript/HTML-driven and does not involve any direct database queries since it basically just accesses the CSV file that Redmine makes available already for each custom query that is saved, provided you are logged into Redmine at the time you access the HTML page.
| custom js chart.png (49.6 KB) custom js chart.png | Output | ||
| custom js chart csv.png (25.7 KB) custom js chart csv.png | Custom query |