Actions
Feature #34830
open
Issues burn down chart in the version detail
Status:
New
Priority:
Normal
Assignee:
-
Category:
Issues
Target version:
-
Resolution:
Description
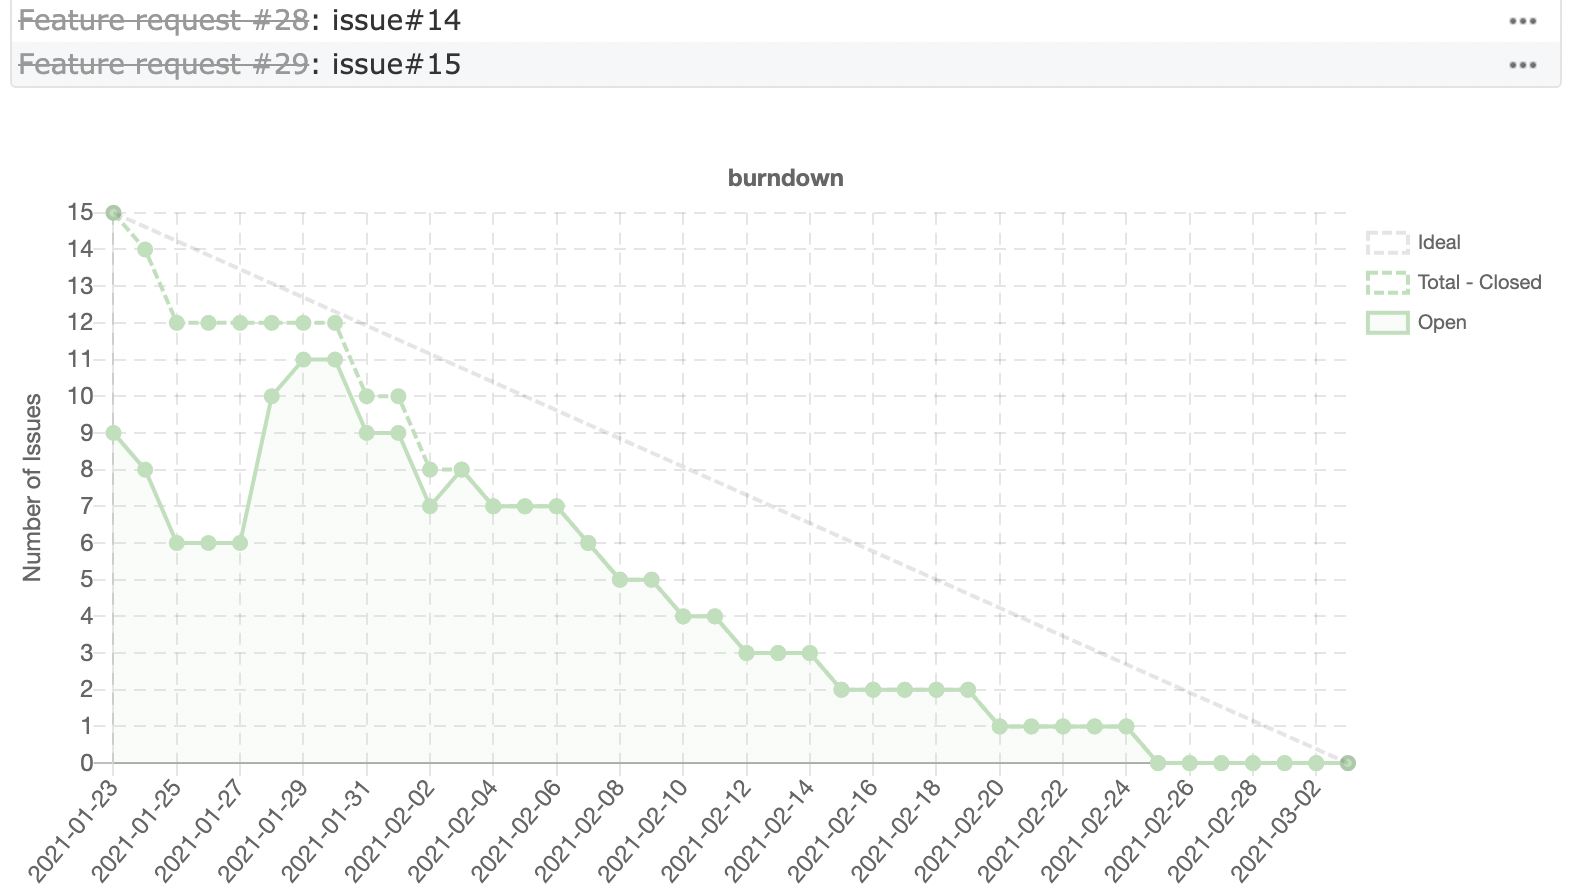
I propose a feature to visualize the changes of Open / Close issues in the version details using 'Burndown chart'.
After applying the patch, a chart like the one in the screenshot below will be added to the version details.
Files
No data to display
Actions