Patch #44567
open
Modernize Gantt chart HTML structure and add row highlighting
Description
This patch modernizes the Gantt chart HTML structure as part of step 3 of #43397. It replaces the legacy table-based layout with a clearer structure that should make the chart easier to understand and extend.
It also adds row highlighting as an initial feature built on the new structure, making wide Gantt charts easier to read.
Changes
Refactor and modernize the Gantt chart layout
- Replace the table-based layout with a flex-and-pane layout.
- Replace
.gantt_hdrby splitting its multiple responsibilities—headers, borders, timeline periods, grid lines, and non-working-day backgrounds—into dedicated structural elements. - Introduce consistent logical rows across the chart.
- Move layout calculations out of the ERB template, making the overall HTML structure easier to see and understand.
Organize the Gantt chart DOM structure and semantics
- Clarify the roles of classes and
data-*attributes. - Use consistent class names and remove obsolete markup.
Highlight corresponding Gantt rows
- Highlight the corresponding row across the Gantt chart.
- Make wide charts easier to read and discuss during screen sharing.
Verification
Visual regression testing
No visual regressions were found through automated checks and manual review.
- 365 before-and-after image comparisons across 42 scenarios in 20 test groups.
- Coverage includes hierarchies, zoom levels, date ranges, display options, interactions, Arabic RTL rendering, printing, and PDF and PNG exports.
Results: https://redmine-gantt-comparison.hidakatsuya.chatgpt.site/
Performance
No performance regression was observed in a heavy test with 400 issues over 12 months at maximum zoom, three additional columns, 80 relations, and the progress line enabled.
| Metric | Before | After |
|---|---|---|
| Page ready time | 1,397.5 ms | 1,361.9 ms (-2.5%) |
| Ruby allocated memory per request | 108.98 MiB | 106.56 MiB (-2.22%) |
| Ruby retained memory per request | 14.96 MiB | 15.04 MiB (+0.53%) |
Manual browser testing
- Chrome, Firefox, and Safari on macOS.
- Chrome on Windows 11.
Next steps
I plan to continue focusing on making the Gantt chart easier to use for reviewing schedules and understanding project status.
- Remembering column widths, adding a sticky timeline header, and adopting the OpenColor palette.
- Improving the internal structure and logic: refactoring view data handling, simplifying absolute positioning calculations, and organizing the Stimulus controllers.
Appendix: DOM structure before and after
| Before | After |
|---|---|
table.gantt-table
└─ tr
   ├─ td.gantt_subjects_column
   │  └─ div.gantt_subjects_container
   │     ├─ div.gantt_hdr
   │     │  absolute header background
   │     ├─ div.gantt_hdr
   │     │  absolute full-height overlay
   │     └─ div.gantt_subjects
   │        └─ form
   │           ├─ div.project-name
   │           │  individually positioned
   │           ├─ div.version-name
   │           │  individually positioned
   │           └─ div.issue-subject × N
   │              individually positioned
   │
   ├─ td.gantt_selected_column × N
   │  └─ div.gantt_selected_column_container
   │     ├─ div.gantt_hdr
   │     │  absolute full-height overlay
   │     ├─ div.gantt_hdr
   │     │  absolute column title
   │     └─ div.gantt_selected_column_content
   │        └─ div × N
   │           individually positioned
   │
   └─ td
      └─ div#gantt_area
         ├─ div.gantt_hdr
         │  absolute header background
         ├─ div.gantt_hdr × months
         │  absolute month cells
         ├─ div.gantt_hdr × weeks
         │  absolute week cells
         ├─ div.gantt_hdr × days
         │  absolute day cells and body grid
         ├─ form
         │  ├─ div.task × N
         │  │  individually positioned bars
         │  ├─ div.task.label × N
         │  │  individually positioned labels
         │  └─ span.tooltip × N
         ├─ div#today_line
         │  absolute
         └─ div#gantt_draw_area
            absolute
|
div.gantt-chart
├─ div.gantt-column
│  [data-gantt-column="subjects"]
│  └─ section.gantt-pane
│     ├─ header
│     └─ div.gantt-pane-body
│        └─ form
│           └─ div.gantt-row × N
│
├─ div.gantt-column
│  [data-gantt-column="status"]
│  └─ section.gantt-pane
│     ├─ header
│     └─ div.gantt-pane-body
│        └─ div.gantt-row × N
│
└─ div.gantt-timeline
   └─ div.gantt-timeline-canvas
      ├─ header
      │  └─ div.gantt-header-row
      │     └─ div.gantt-period × N
      └─ div.gantt-timeline-body
         ├─ form
         │  └─ div.gantt-row × N
         ├─ div.gantt-today
         └─ div.gantt-relations
|
The new structure removes the layout table and the generic .gantt_hdr, separates headers from body content, and introduces consistent pane and row structures across the chart.
Files
Related issues
 Updated by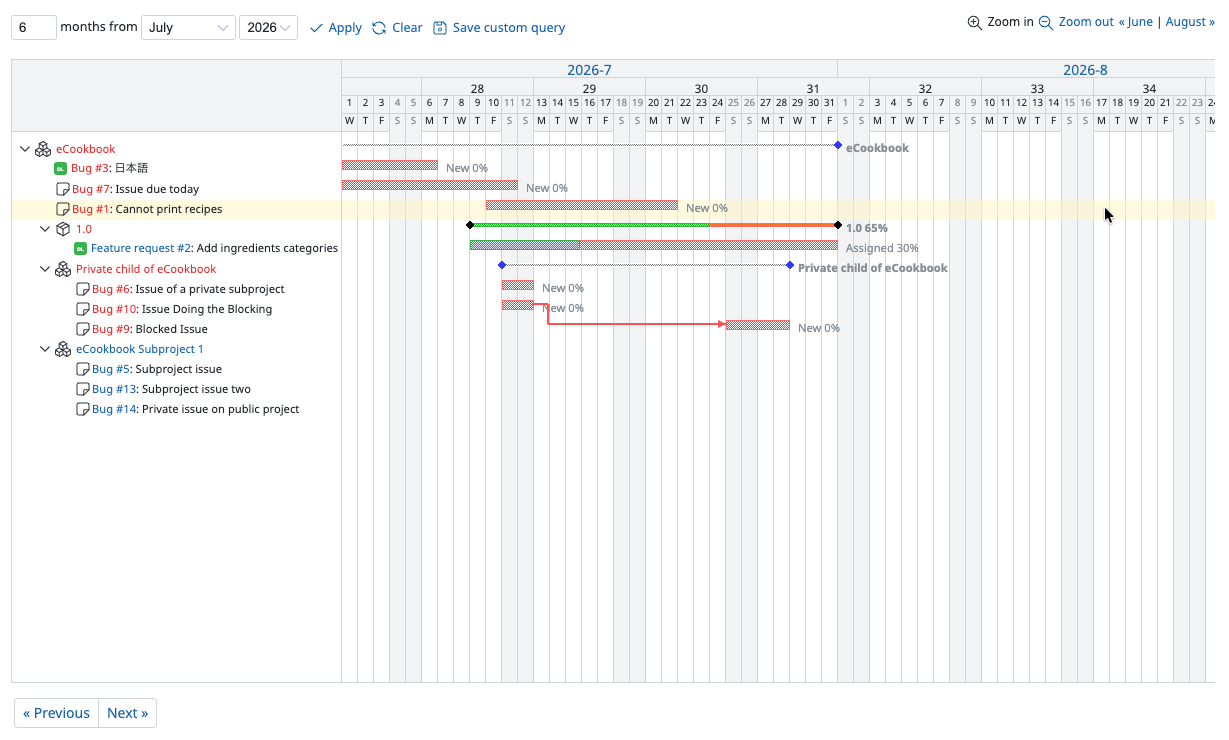
 Updated by