Actions
Feature #31581
open
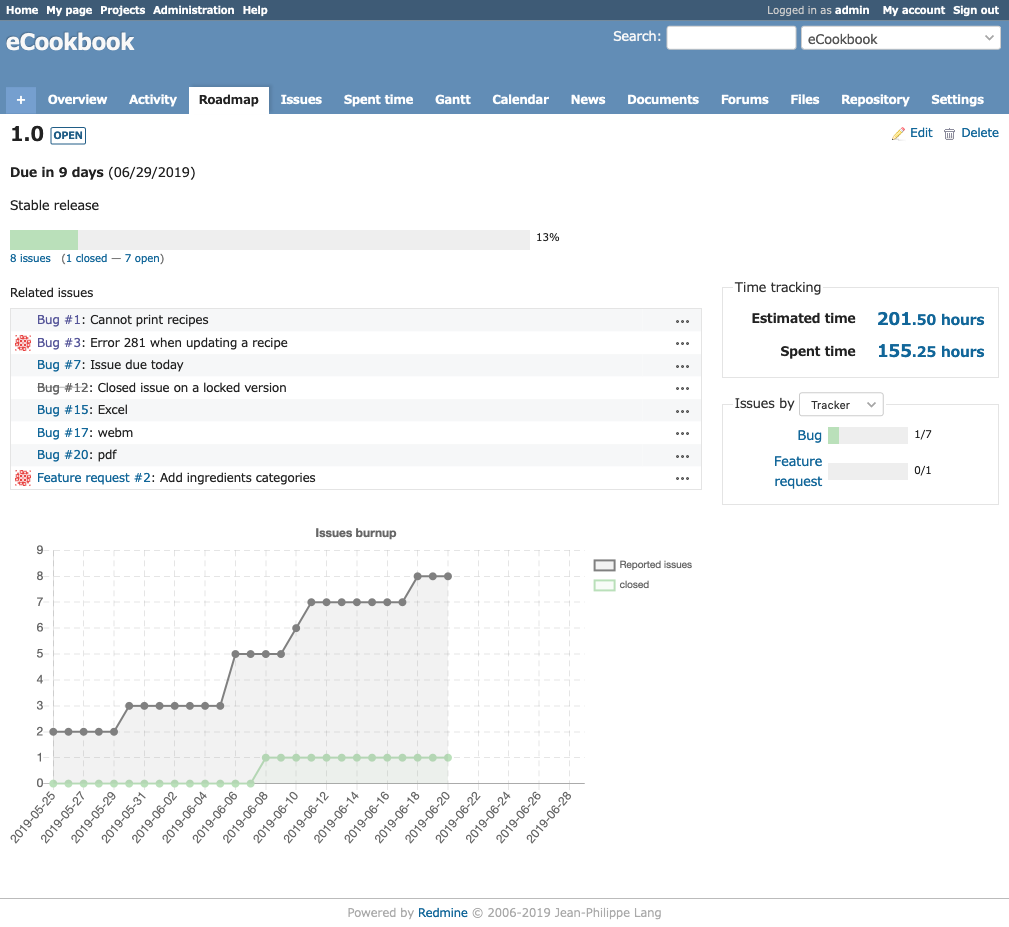
Issue burnup chart in the version detail
Status:
New
Priority:
Normal
Assignee:
-
Category:
Roadmap
Target version:
-
Resolution:
Description
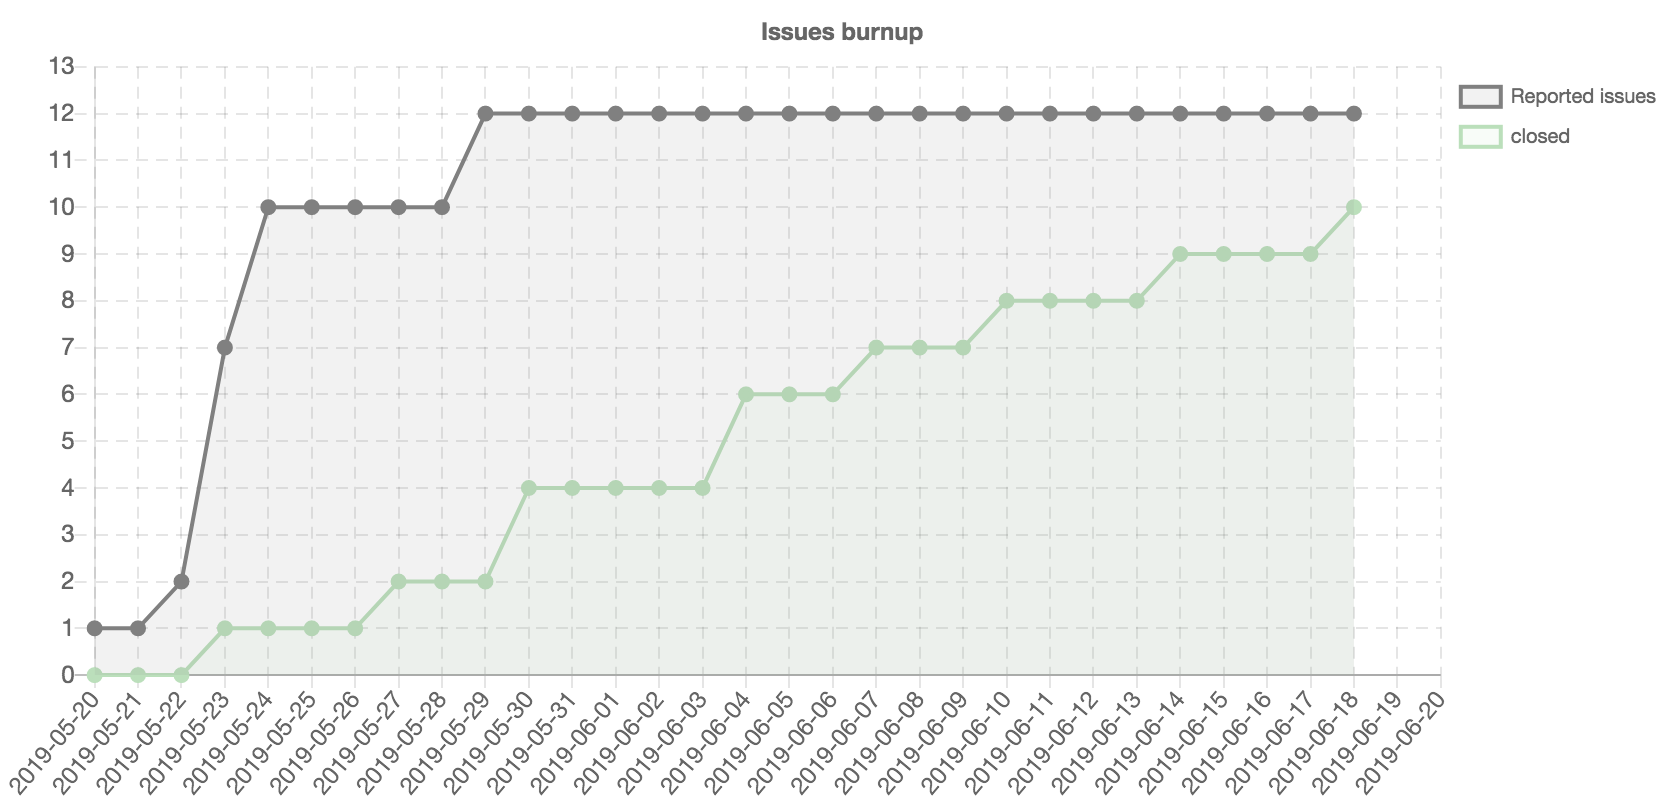
I propose a feature to visualize the changes of registration / completion of issues in the version detail using 'Burnup chart'.
By visualizing with Burnup chart, we can intuitively grasp the change of issue registration / completion in the version.
Files
Related issues
 Updated by
 Updated by Go MAEDA about 7 years ago
 Updated by Marius BĂLTEANU about 7 years ago
It is an interesting feature, but I'm not sure how to read the chart. Go Maeda, Takenori TAKAKI, can you explain a little bit what we should understand from the chart?
 Updated by Takenori TAKAKI about 7 years ago
Thanks for the comment, Marius.
I think that we can understand from the chart when & how many tickets were created and closed in the version. And when we have these information, we can make an outlook whether it is possible to complete all the tickets registered on the version by the due date.
Updated by Go MAEDA about 6 years ago
- Related to Feature #31449: Generate issue graphics added
Actions