Actions
Feature #31581
open
Issue burnup chart in the version detail
Status:
New
Priority:
Normal
Assignee:
-
Category:
Roadmap
Target version:
-
Resolution:
Description
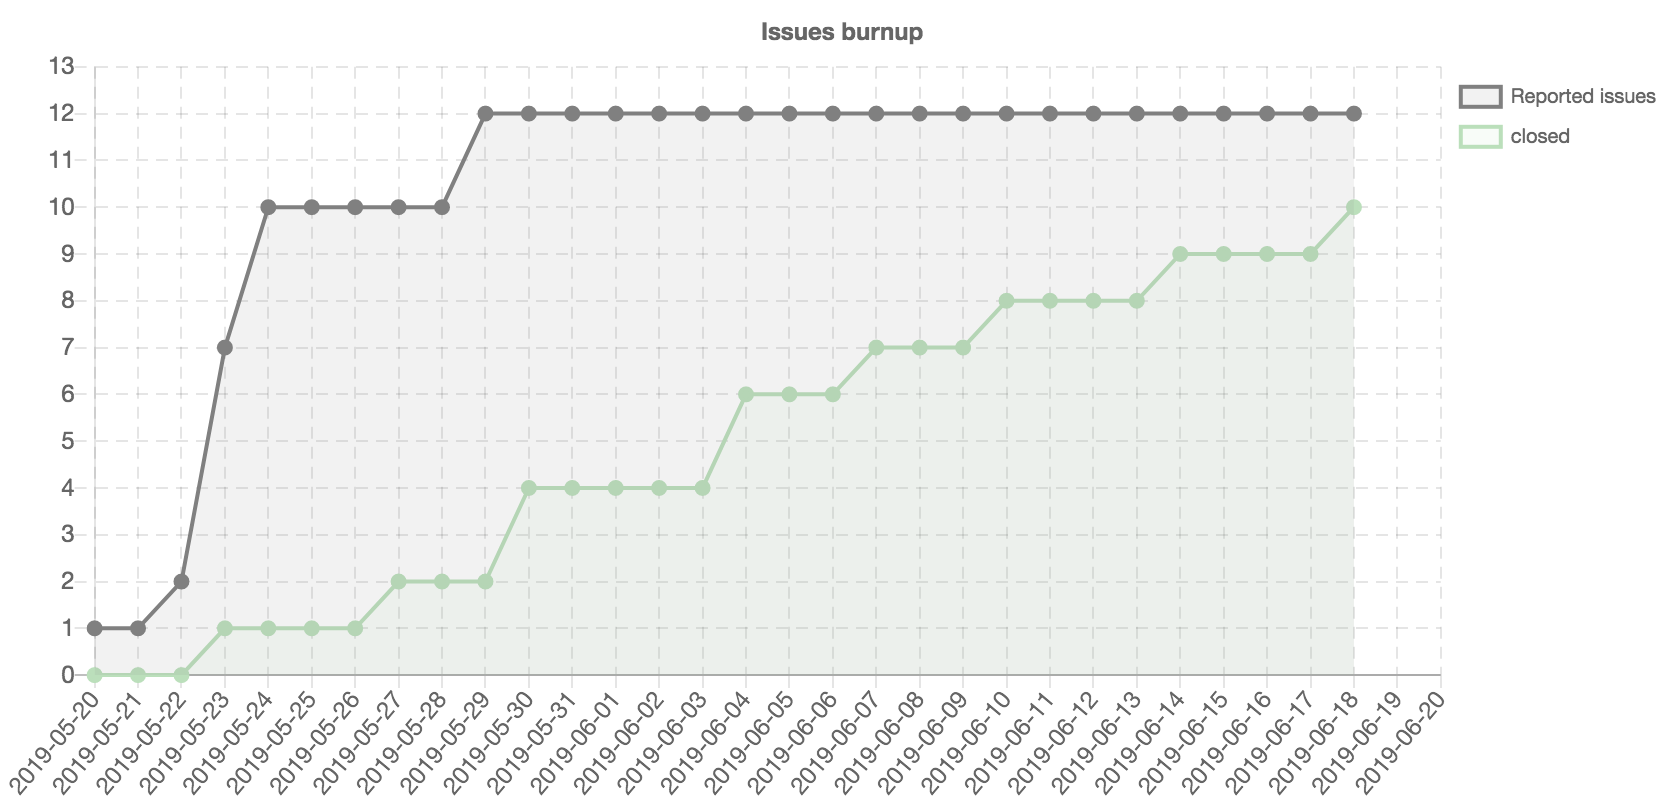
I propose a feature to visualize the changes of registration / completion of issues in the version detail using 'Burnup chart'.
By visualizing with Burnup chart, we can intuitively grasp the change of issue registration / completion in the version.
Files
Related issues
 Updated by
  Updated by
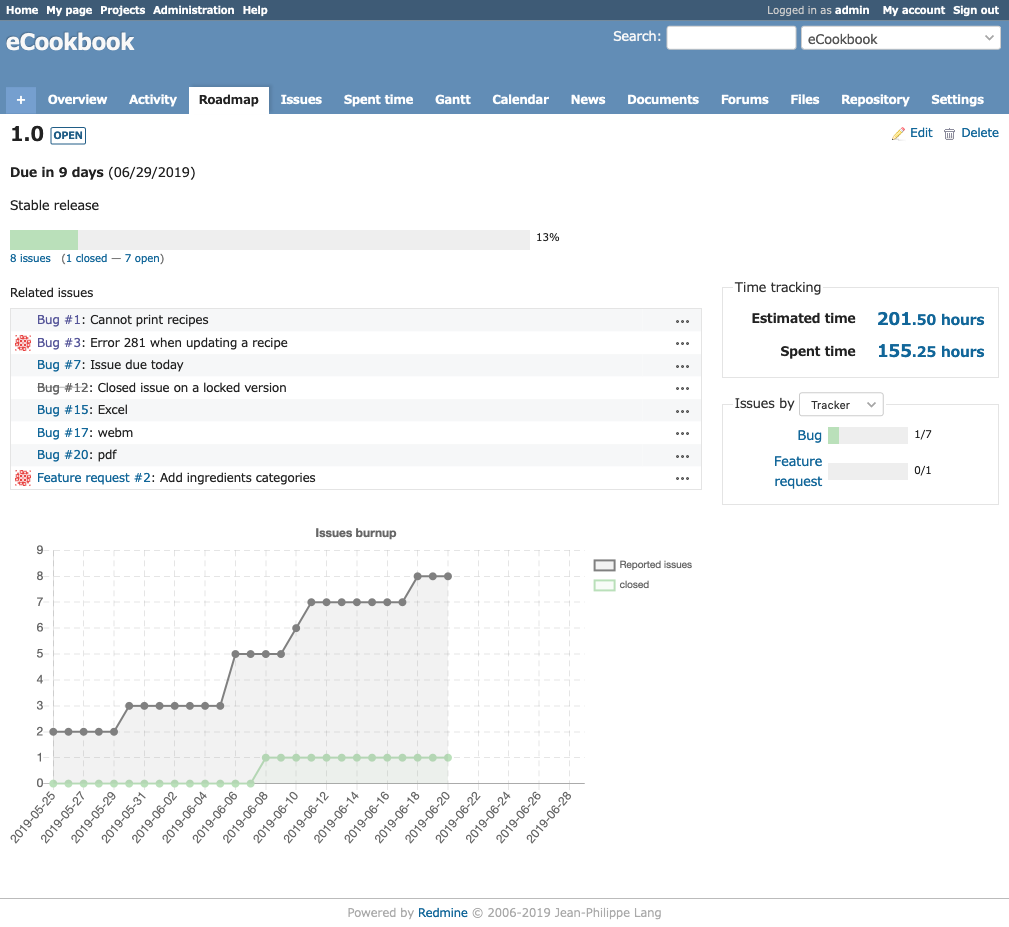
 Updated by
  Updated by
Actions